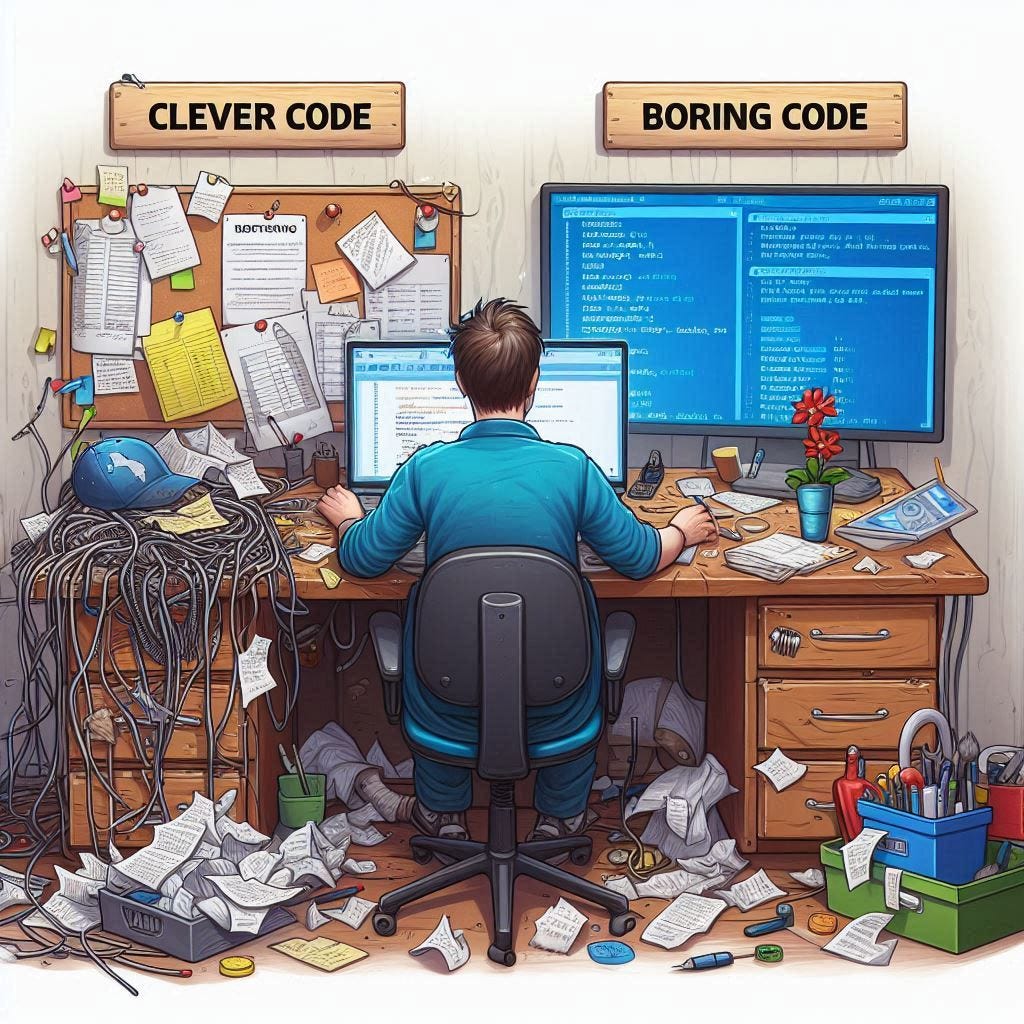
Debuggability is highly underrated Link to heading
In the words of Brian Kernighan, the famous computer scientist and author of the book “The C Programming Language”:
Debugging is twice as hard as writing the code in the first place. Therefore, if you write the code as cleverly as possible, you are, by definition, not smart enough to debug it.
This quote reflects a common experience many developers face while trying to write “smart” code. They often end up with complex solutions that are hard to maintain and debug. This is a common mistake, driven by the desire to demonstrate skills (and maybe to appear clever).
So… just write boring and straightforward code. Organize it into small, independent modules with clear interfaces and low coupling. This makes it easier to isolate and debug issues within specific components without being affected by the rest of the system.
How to organize a drawer the right way
Code is written once but read many times
Make your code readable and self-documented. This means code that follows good naming conventions, uses descriptive variables and function names, and includes clear comments (if needed).
When implementing your solution, you must think about how it will be executed. You probably focus on the happy trail, but you should also consider how it will fail and how you will debug it in production. Not doing so results in a mistake that can waste a lot of time and effort looking through complicated code to figure out and fix the problem.
To address this challenge, one must shift her mindset and prioritize debuggability from the start of the project.

This means leaving breadcrumbs, also known as logs, storing data in machine-readable format to enable efficient parsing and analysis, capturing valuable information about the application’s state, execution flow, and any errors or exceptions. There are several error-handling mechanisms that catch and report issues as early as possible, making it easier to identify and fix bugs. The logs from the different components and services will be collected into a centralized system for easier aggregation and querying.
In some cases, logs alone don’t give us the complete picture of how a system is doing. It’s a good idea to use metrics, which help us understand the system’s health, performance, and behavior more completely. I’m a big fan of metrics because they give us a clearer view. You can detect anomalies and track quantities over time. Based on the collected data, you will build monitoring dashboards that provide real-time visibility (and alerting system).

Another tool in the debugability arsenal is tracing, which tracks the flow of “requests” across different services and components, enabling us to visualize and analyze the end-to-end journey of a request and pinpoint bottlenecks or failures.
Furthermore, investing in administrative tooling that reflects the system’s state by exposing APIs or CLIs can greatly enhance debuggability by allowing developers and administrators to interact with the system, query its state, and perform various tasks such as triggering debug modes, capturing snapshots, or executing diagnostic commands.
Lastly, live debugging tools like Rookout, Datadog, and Lightrun allow you to debug code in production without any code changes. This is quite amazing and it is done by incorporating their agent into your code that does dynamic instrumentation. This agent is a bridge between your code and their environment. It monitors the code’s execution and identifies points in the flow (such as function calls or variable assignments), and it does some optimization not to instrument everything based on the learned history of “hot” paths to minimize the performance hit.

Simple code works better than complicated code. Link to heading
To conclude, writing boring and straightforward code, combined with various observability techniques, which should be included as early as in the design stage, can significantly enhance your system’s debuggability.