Occasionally you’ll get into a situation where a problem happened in your application, and you don’t have access to your source code and\or symbols.
At that moment, one of your better options is to decompile your code and debug it. IMHO, one of the best free tools out there is dnSpy, developed by 0xd4d (respect).
According to him, dnSpy is an improved ILSpy decompiler that enhanced by Roslyn (C# / Visual Basic) compiler and many other open source libraries. This tool supports editing and debugging assemblies (any .dll or .exe file) even if you don’t have any source code available, isn’t that amazing?
Quick setup Link to heading
Head to https://github.com/0xd4d/dnSpy/releases and download one of the latest releases depending on your needs, whether it’s .NET Core, .NET framework or Unity debugging.
Make sure Microsoft Visual C++ Redistributables are installed, if not you can find at https://support.microsoft.com/en-us/help/2977003/the-latest-supported-visual-c-downloads.
Other than that, each of the releases relies on a different framework, so make sure to install them too.
Note that, the developer mentioned that Windows 7: Must have KB2999226 and KB2533623 installed.
Keep it simple, stupid Link to heading
Using dnSpy is quite easy. Same experience as using Visual Studio. It sure feels that the developer put effort into making it that way.
You can start debugging your assembly by pointing to the assembly path, insert a breakpoint where you want, and that’s it.
Another option is to attach to a running process, similar to Visual Studio experience. Just launch dnSpy in X86 or x64 architecture, depending on the assembly.
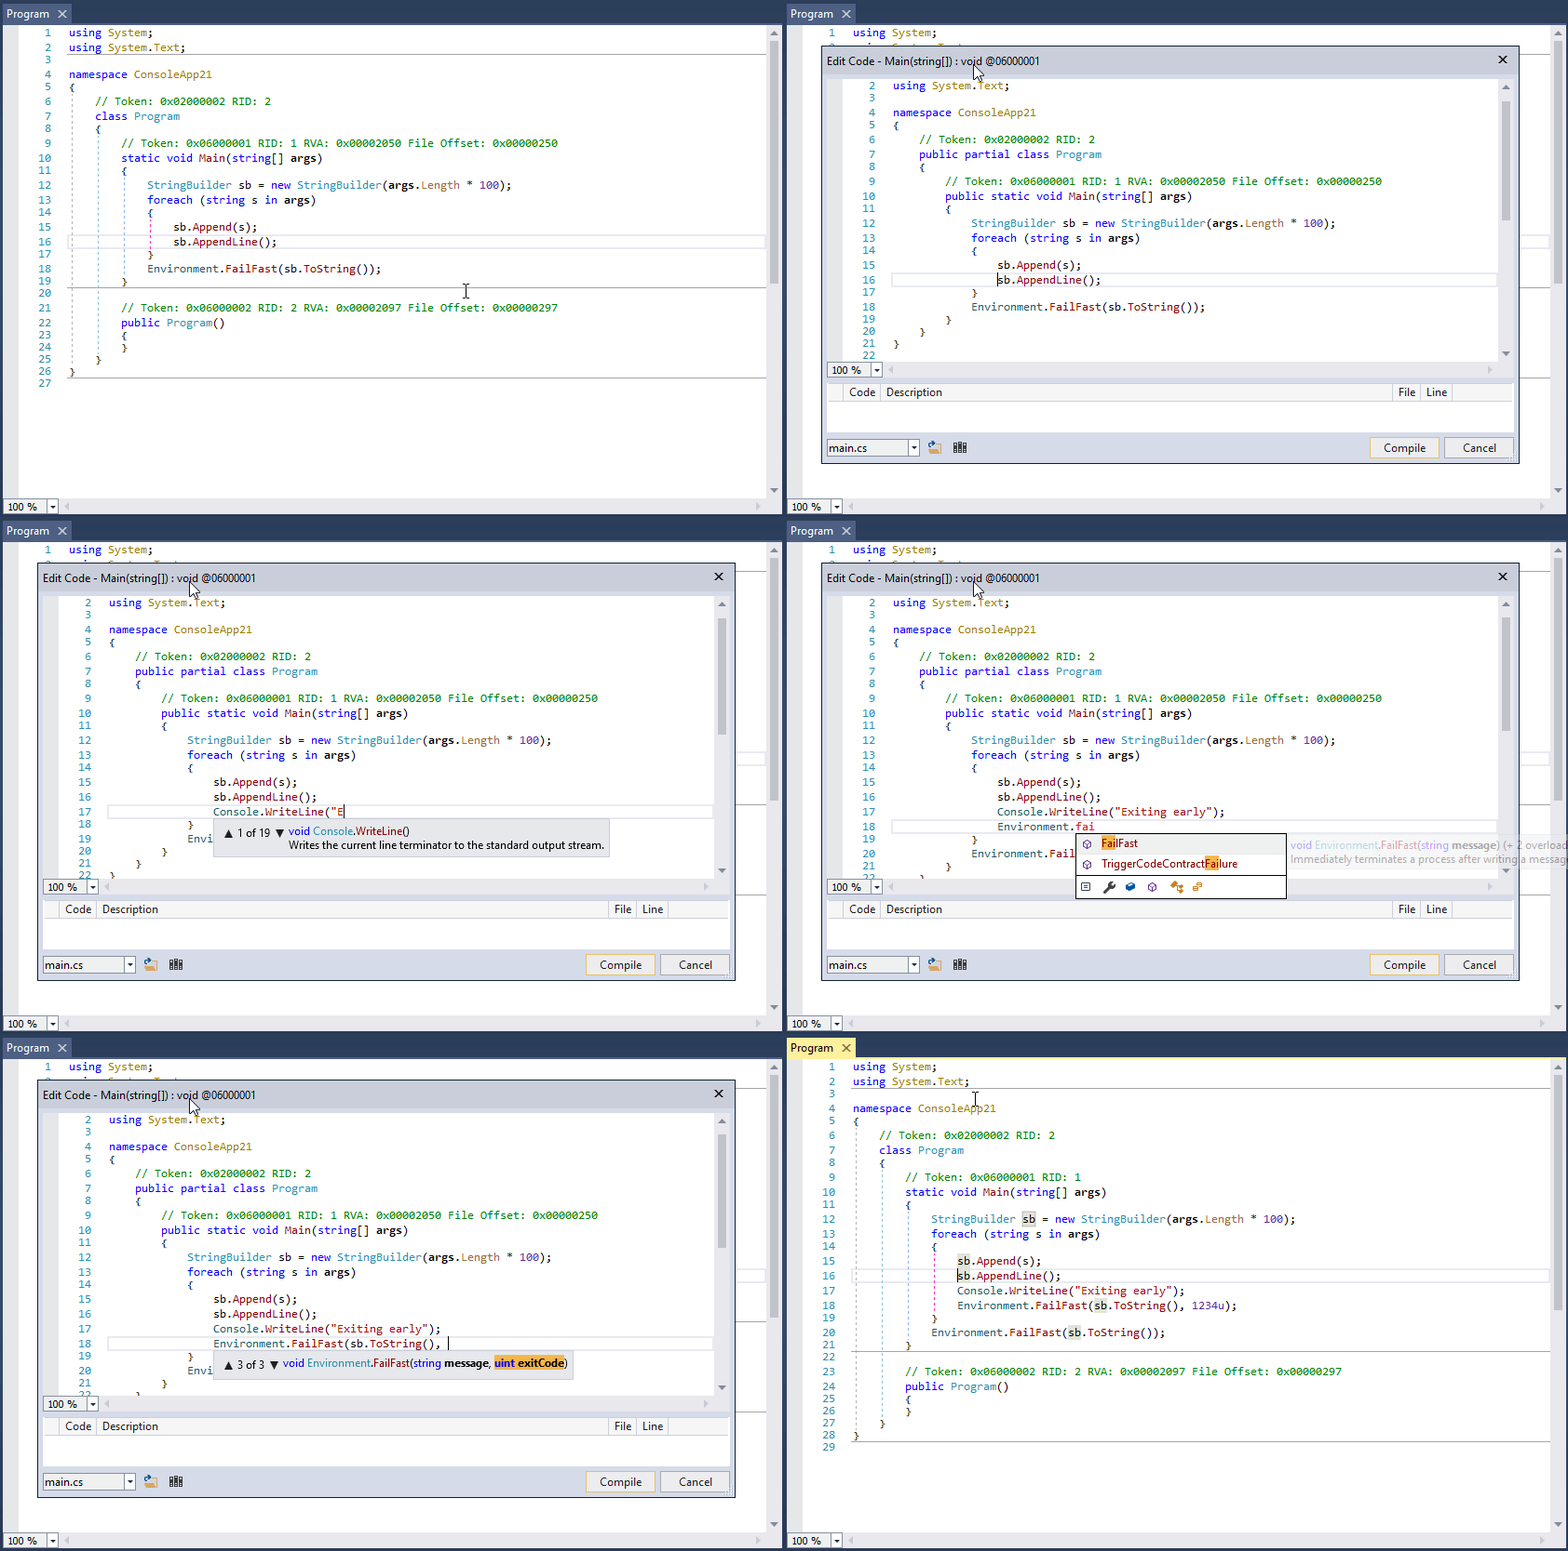
In the video below, you can see that Visual Studio experience I’ve previously mentioned. I wrote a simple application that adds a number and a new line to a StringBuilder. dnSpy allows me to step into assemblies (which decrypt themselves at runtime) and debug line by line. Locals, watch, autos windows are supported too.
More features are supported such as the ability to edit an assembly in such way you’ll be able to edit the current assembly’s metadata, methods and, classes.

Edit current method
You are even able to add new methods, classes or members (in C# or Visual Basic).
Gimme more… Link to heading

The assembly editor supports changes for low-level IL method body and metadata tables using a hex editor. You can go back and forth between decompiled code and IL, all you have to do is a click on an address in the decompiled code, and you are at the IL method body or the opposite way by pressing F12 in an IL body to go back into the decompiled code.
Also, dnSpy can search for methods, assemblies, and strings as done in Visual Studio. Find all class and method usage, callers, and more.
Basic IntelliSense implementation is supported, and even the C# Interactive window is available too.
For more information and advanced topics, go to the Wiki page, where 0xd4d describes how to add extensions, building dnSpy by yourself and, debug Unity games.
dnSpy got the looks; you can choose between blue, light and dark themes (and a dark high contrast theme). The tool is translated into ten different languages, which is quite impressive for an open source; it sure demonstrates the strength of the community. As well, if you’d like to contribute and translate dnSpy to your native language, a dedicate crowdin project is active at https://crowdin.com/project/dnspy.

You Got It Dude Meme
To wrap it up, although there are other excellent alternatives (such as dotPeek, JustDecompile), dnSpy is an open-sourced handy tool that has straightforward user experience for anyone familiar with one of the leading IDEs. As far as I see it, dnSpy is a must for any SW engineer’s toolbox.