Binding issues? Struggle with that hard to solve UI bug? Trying to understand how to fit the entire string into TextBox’s dimensions? These situations and many others are common for us, .NET and WPF developers.
Most of the times, issues, as mentioned above, are solved by using a debugger.
Imagine it; you want to change the size of a specific graphic element. Well, you open the relevant project (using Everything tool 😉) in your favorite IDE, make some changes, compile, deploy, and rerun the application. Then you attach a debugger. Investigate and rerun the whole process again until you solve the issue.
Well, It takes time. A LOT of it.
Snoop was developed by Pete Blois to ease the pain of debugging your WPF application. This open source WPF spying utility, now maintained by Cory Plotts, allows on the fly visual tree changes, troubleshooting binding failures, and more…

xkcd: Compiling
Spying on your app Link to heading
Download and install Snoop from its Github repository:
Launch Snoop and drag the snooping cross-hair to your WPF application.

Snoop window, the snooping cross-hair is marked with a red rectangle
Snoop window, the snooping cross-hair is marked with a red rectangle
A new window is opened. On the left, the application’s visual tree is displayed while on the right, the property editor is visible for each element in the list. Below a GIF that demonstrates the primary usage of Snoop. It can be seen that one of TextBlock’s Text property content is being edited on the fly.

Snooping example
Features Link to heading
Ctrl+Shift keyboard buttons and hovering over the desired element is a productivity boost. It causes Snoop to jump immediately to the hovered element’s properties, which saves you the effort of going down the visual tree to find the desired control, as seen below:

Ctrl+Shift trick
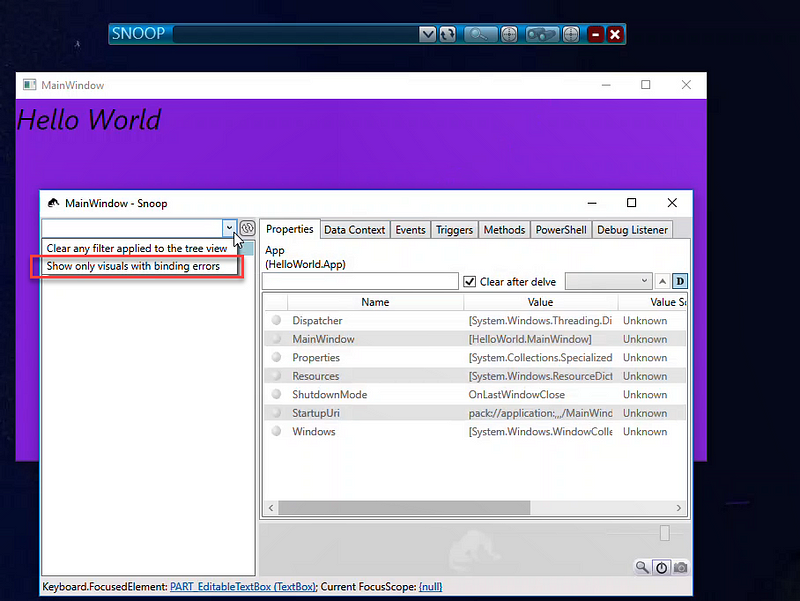
Another trick is to search the property you would like to change in the filter box. Furthermore, a useful feature is the “Show only visuals with binding errors” option found in search-bar drop-down located above the visual tree view.

Show only visuals with binding errors
It shows components with binding issues. In such way, it saves time to identify any binding failure using your IDE.

Moar Features
There are more features in Snoop which are less used (IMHO). For example, the power-shell which is a console where you can write methods and interact with the UI through commands. Events tab that lists all the fired events per your limited choice and triggers tab for debugging any changes happened for control or style through a trigger, whether it is a property trigger, DataTrigger or EventTrigger.
Summary Link to heading
Although its UI is not much user-friendly, I’ve found it to be handy for finding missing bindings and tweaking layout parameters. As well, overcoming the effort of debugging an unfamiliar complex user interface since Snoop projects the visual tree and allows to navigate in it quickly.
Furthermore, Similar WPF spying utilities exist (such as Mole and WPF inspector), but Snoop has an active open source development, and it saves you the headache of using your IDE for debugging your application. I cannot imagine developing WPF interfaces without it.
BTW, HawkEye (Maintained by Olivier Dalet) is another opensource tool with similar capabilities that allows snooping your WinForms application.