
Back in 2016, I saw a demo at a conference about a new visual studio extension that presumes to change the way an engineer debugs, they called it, magic debugging. Little that I know, it turned my debugging way of thinking upside down, indeed a magical approach.
Before I’ll continue, I owe a disclaimer for the readers. A previous colleague of mine is one of OzCode’s co-founders (Omer Raviv). Although it might harm the credibility of this blog-post, I’ll take the risk; for the reason that these lines were written by a happy user 🤓. My goal is to share with you my perspective on some of OzCode’s helpful features and why you should try it out too.
What can OzCode do? Link to heading
The primary purpose of this visual studio extension is to help you debug code and find the root cause of problems, a sort of online ReSharper. In the next paragraphs, I write about my favorite features, yet OzCode has more to offer.
DataTip Link to heading
One of the valuable features is the DataTip; it replaces the dole visual studio tool-tip with much information, and it helped me in various defect debugging situations.
It contains a swift search functionally. It will go through any object’s fields and values and into several levels in the object’s hierarchy. Note that you can define as many levels as you want.
Each item is presented by the ToString() implementation of the class (seen as OzCodeDemo.Customer in the gif below_)_, but here comes OzCode to the rescue with the neat feature — reveal. By staring properties, you’ll be able to the ones that interest you the most.
Another useful option is the Export feature. You can extract each object internal into JSON/XML/C#, a helpful capability for creating mocked objects during unit testing, which saved me time. Also, the basic VS functionality is not neglect, you can instantly copy value or add a quick watch.
LINQ Debugging Link to heading
LINQ is one of the used features in C#, while one of his pitfalls is when debugging it. Developers have tried to overcome this by evaluating part of the query using Visual Studio’s QuickWatch window, placing (conditional) breakpoints in the lambda expressions for assessing each element individually, or by logging your progress. As you can see, it’s pretty cumbersome to debug it, so OzCode solves that exact need.
When hovering over LINQ expressions, you’ll see bubbles containing numbers. You can click on each bubble to analyze the evaluated LINQ expressions, each term in his stage. Combine it with the Reveal feature, and you are a rockstar.
LINQ expression debugging
Time Travel Link to heading
Time travel — jump into specific iteration
OzCode simulates the results of future code execution without actually running it. In such a way, you’ll be able to detect bugs by jumping into specific loop iteration to the exact moment of failure without the need to step over your code in real-time. Using the heads up display feature that highlights the evaluated value of your code, a powerful feature by itself (extremely UX-oriented), you can investigate what happened. It saves you time for re-running a defect’s scenario multiple times while hunting for root-cause.
Note that time travel doesn’t work when accessing external resources such as a database or native code since it can’t be simulated without affecting the application’s state.
Tracepoints Link to heading
Another useful feature is Tracepoints, which allows logging your debugging scenario into the editor’s viewer. Thus, quickly analyze any issue, even a multi-threaded one, as can be seen in the image below where different messages arrive from various processes and threads’ Ids.
Tracepoint viewer — demonstrate multithreaded info
Compare Link to heading
You can even compare objects and collections in memory. One excellent option is to take a snapshot and compare the same object across different points in time.
Compare in action
Exception trail and prediction Link to heading
This feature has proved himself as valuable (for me) over and over again. It allows you to view all relevant exception information. Furthermore, inner-exception can navigate easily along the StackTrace, all in an interactive and clean UI.
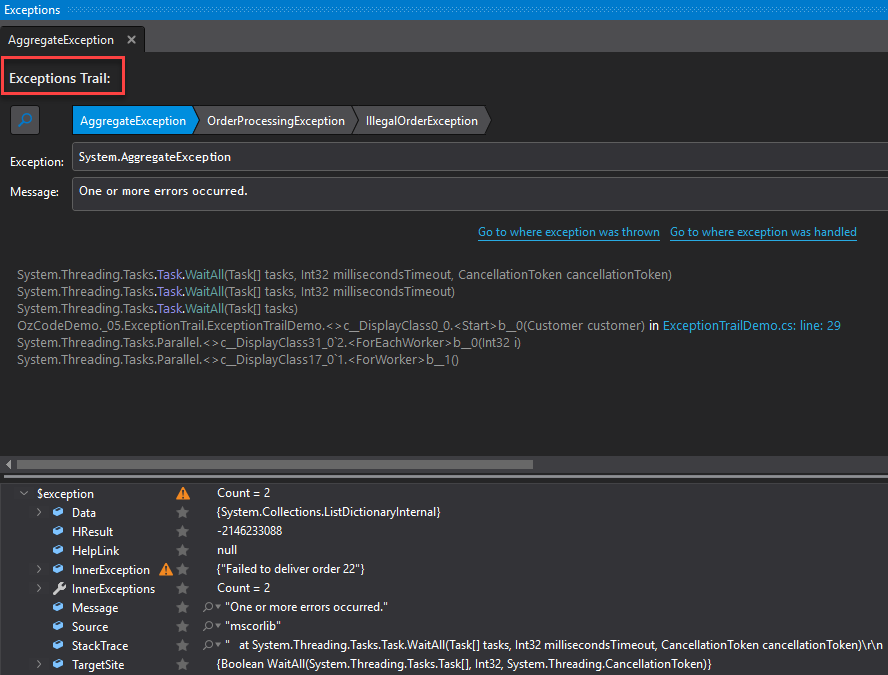
Exception trail
Using the heads-up display, you get an alert that an exception is going to happen. When encountered, you can quickly skip and ignore it for smooth debugging or decide to handle it.
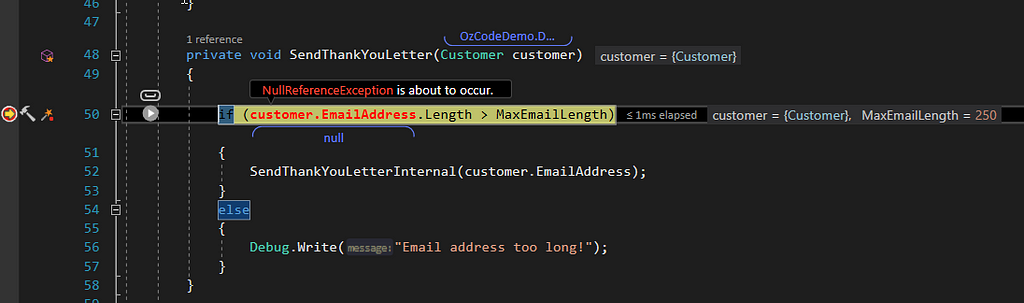
An exception is about to happen
Show all instances Link to heading
Search for any object in memory. That simple.
It might be used to understand if an object is still alive and why.
There are more features in OzCode, which I’ve not described, such as — quick attach to process, custom expressions, quicker breakpoints, and more. That being said, one can leverage his debugging skills and bring more value efficiently while using it, making OzCode a must-have tool in any C# developer’s toolbox.
Note that, a free trial can be downloaded from here
Furthermore, OzCode team made sure to create a digital walk-through of all their features (which I’ve used as part of writing this blog-post), accessible here: https://github.com/oz-code/OzCodeDemo